Philadelphia rentals ebb and flow just as sales do. There are peak rental seasons, slow rental seasons and the demand differs from neighborhood to neighborhood.
(Read our leasing incentive suggestions for getting tenants in a slow rental market.)
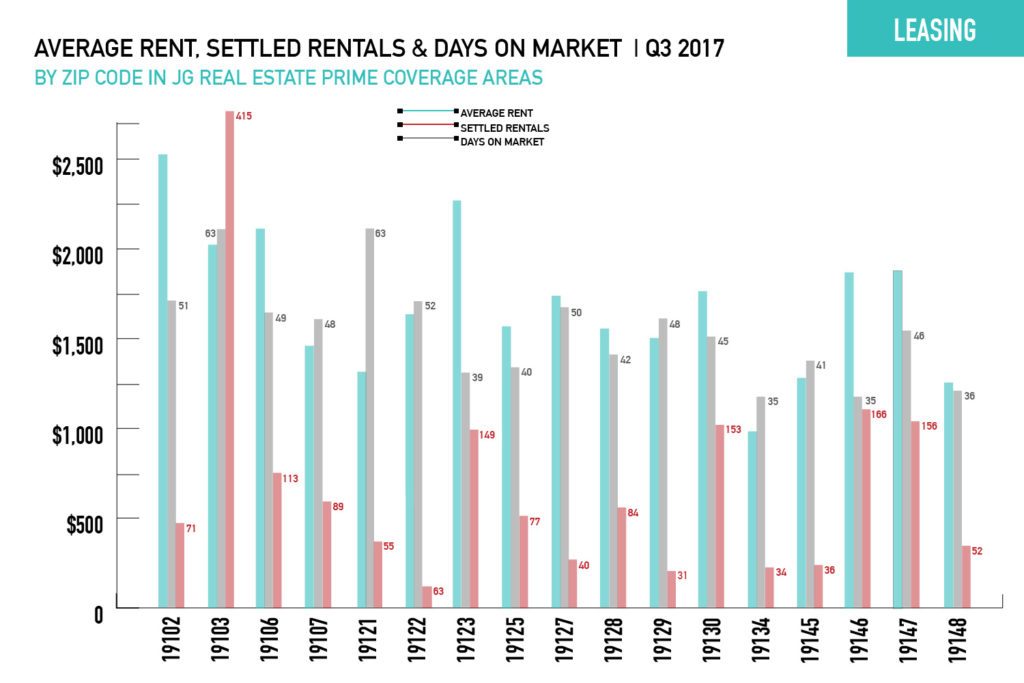
Real Estate Rental Statistics for JG Real Estate Primary Coverage Areas | *Data collected from Trend MLS, Q3 2017
The above graph shows the total number of settled listings, average monthly rent and the average number of days on market (DOM) for the zip codes within our property management coverage areas.
Seeing how the zip codes compare to one another provides insight as to which areas of the city are more “rentable” than others. DOM is a direct indicator of that area’s market activity in terms of supply & demand – large inventory means it may take units longer to rent, but when you take into account the number of units that did actually settle, the DOM may be telling more about the neighborhood itself.
For example, 19103 (Rittenhouse Square / Logan Square) tied with 19121 (Brewerytown / Temple University) for the highest average DOM at 63 days. These are two extremely different neighborhoods. 19103 had the highest number of overall settled rentals (by far), while 19121 had one of lowest. This tells us that 19103 is still very rentable (also one of the highest average rents) – the DOM is affected by a large inventory, while in 19121, there is something happening in the area beyond inventory affecting the rental market. Perhaps an oversupply of outside options, like an increase of student housing at Temple University, or perhaps the area itself isn’t as popular to tenants right now in general.
Regardless of the reasons for the differences in a neighborhood, it shows the importance of utilizing agents who have direct knowledge of and experience with neighborhood nuances so that rentals are priced appropriately from the start.
So what do the above statistics tell us about which neighborhoods have performed the best this past quarter? Look for high number of listings that settled combined with low numbers of days on market.
If the average DOM is around 30 days, that zipcode is performing very well. 19146 (Graduate Hospital & Point Breeze) performed the best of all. 19123 (Northern Liberties) and 19147 (Queen Village / Bella Vista) come in 2nd and 3rd place, for us.
Next to consider – How does the Philadelphia Rental Market in Q3 of 2017 compare to Q3 of 2016?
Because the real estate market is so seasonal, we need to compare the current quarter with the same one of the previous year. Doing so provides insight into the overall health of the rental market.
Below, the graph demonstrates overall averages, taking all zip codes into consideration:
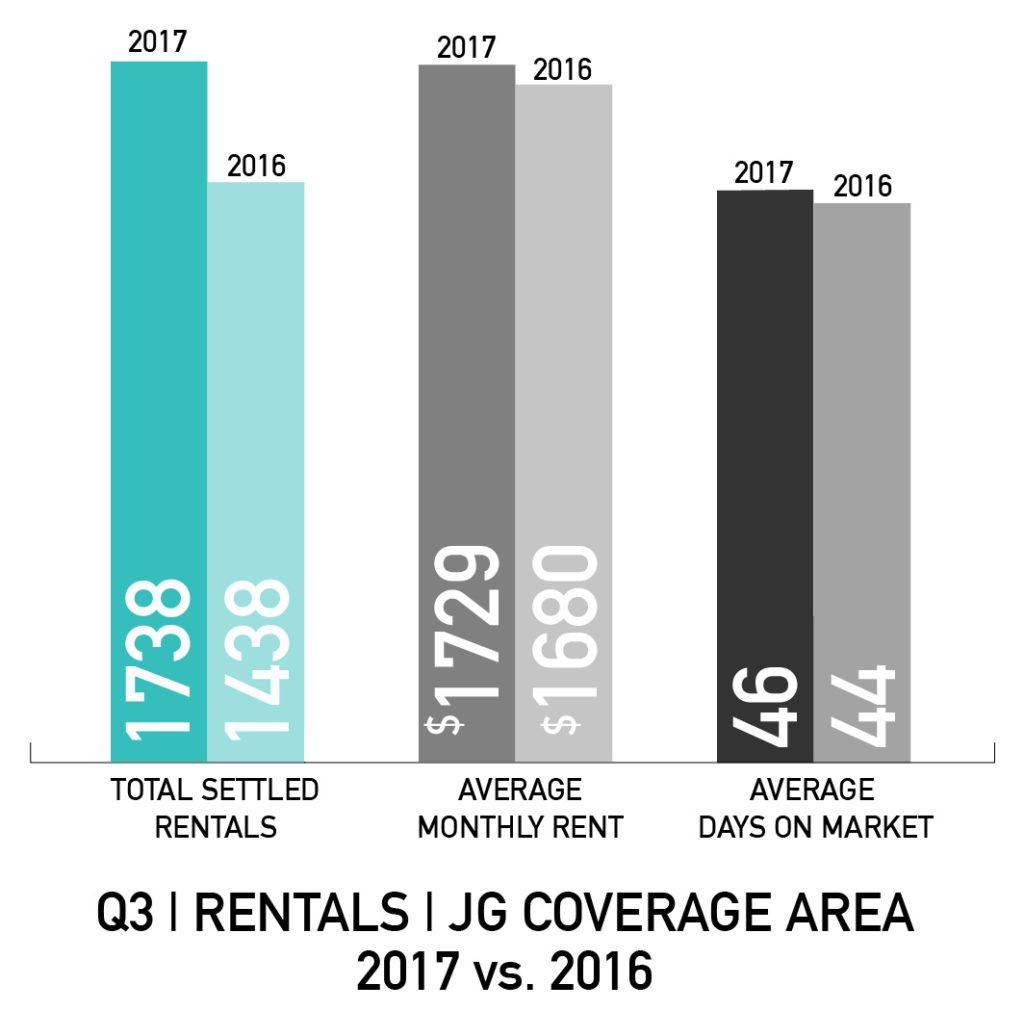
JG Real Estate Coverage Areas | Averages of 2016 vs. 2017
Overall, the total number of settled rentals increased by 300 properties. The average monthly rent increased by $49.00. The average days on market increased by 2 days. DOM has been steady, then. Such a small increase is not cause for concern, but if over time we see it continuing to rise it indicates an oversupply of available rentals. While the average monthly rent did increase, which is good news in a landlord’s eyes, the increase was not substantial. The difference was approximately a 2.9% increase. As a frame of reference, when we write our leases to renew for another year, we write in a renewal increase of 5%. So taking into consideration what the market is telling us, at least in comparing these two quarters with each other, if your tenant wants to renew but wants to negotiate a lower increase in rent, it would be our recommendation to take them up on it if they’ve been reliable, responsible tenants thus far. The cost of turnover work (painting, repairs, cleaning) and the potential for vacancy would be higher than renewing at a lower rate.
The 3rd quarter, covering July, August and September, is one of the best times of year for rentals (Q2 is also very busy). We expect these numbers to be very different once the statistics come out on Quarter 4.